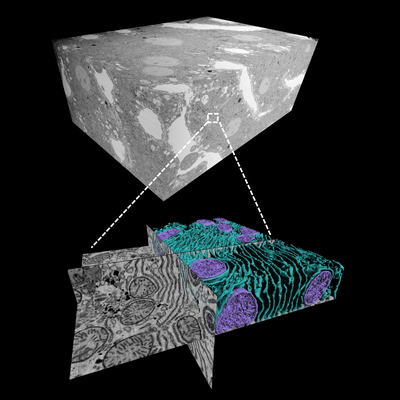
6461 is Lean liver dataset - 12000 x 8000 x 5638 voxel, 8nm isotropic resolution. There are 5638 consecutive raw FIBSEM images and 5638 corresponding images in each segmentation class (ER, ER sheets, ER Tubules, Mitochondria, Lipid Droplet, Cell Membrane, Nuclear membrane)
6464 is Obese1 liver dataset, 9112 x 10200 x 7896 voxel, 8nm isotropic resolution There are 7896 consecutive raw FIBSEM images and 7896 corresponding images in each segmentation class (ER, ER sheets, ER Tubules, Mitochondria, Lipid Droplet, Cell Membrane, Nuclear membrane)
9430 is Obese2 liver dataset, 8000 x 8050 x 8501 voxel, 8nm isotropic resolution There are 8501 consecutive raw FIBSEM images and 8501 corresponding images in each segmentation class (ER, ER sheets, ER Tubules, Mitochondria, Lipid Droplet, Cell Membrane, Nuclear membrane)
1857 is Obese Climp63 liver dataset, 9700 x 9650 x 3629 voxel, 8nm isotropic resolution There are 3629 consecutive raw FIBSEM images and 3629 corresponding images in each segmentation class (ER, ER sheets, ER Tubules, Mitochondria, Lipid Droplet, Cell Membrane)
The evaluation was performed on down-sampled data. A down-sampled version of the raw data is provided as well. Raw data, manual annotation data and predictions are provided as tiff stacks (8bit or 32bit, compressed, packaged in a .zip container). For lipid droplets, mitochondria, nuclear membrane and ER, we selected 3 test volumes of 300×300×50 voxels at random locations. Object based scores were only calculated for mitochondria and lipid droplets. For ER sheet and tubule evaluation, we randomly choose an area of 750x750 pixel^2 at 4 different locations in each dataset. Raw data, manual annotations and predictions are provided.